With very few exceptions (the national census is one notable example), studies use samples drawn from a population. Political polls attempt to learn about attitudes towards various issues not by asking every adult in the country but by taking a sample. A drug company conducting a randomized clinical trials on a new analgesic will select a sample from among the entire population of people with the type of pain targeted by the drug.
But from samples inferences about the population must be inferred. That’s where most statistics come in. In fact the purpose of most statistics is really just to allow making valid generalizations about a population of interest based upon a sample.
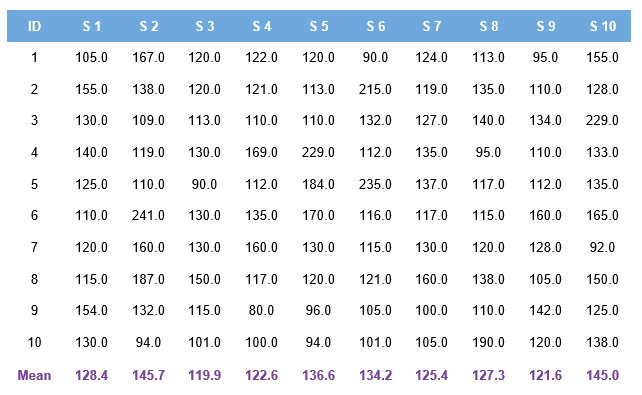
Say an analgesic drug trial involving 200randomly selected participants receiving the active drug shows an averageimprovement of 3.5 points on a 0 (no pain) to 10 (very high pain) point scale.But that’s 3 points with this particular sample. Imagine that the researchersdipped into the population and pulled out a different set of 200 randomlyselected participants. The mean change would likely not be exactly 3.5. Itwould likely be different.


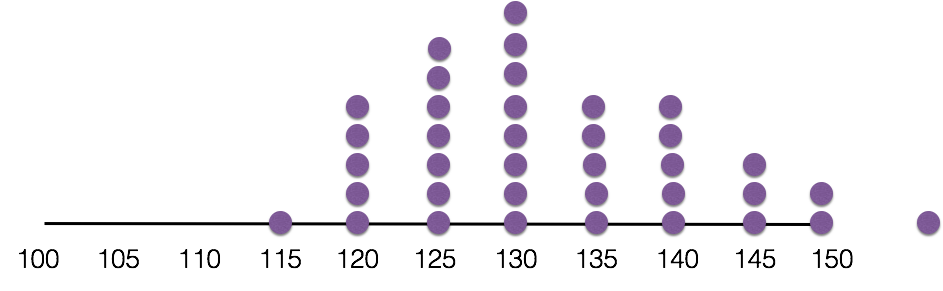
As the number of samples increases they willnaturally congregate into the shape of a normal curve. This is called the sampling distribution of the mean.
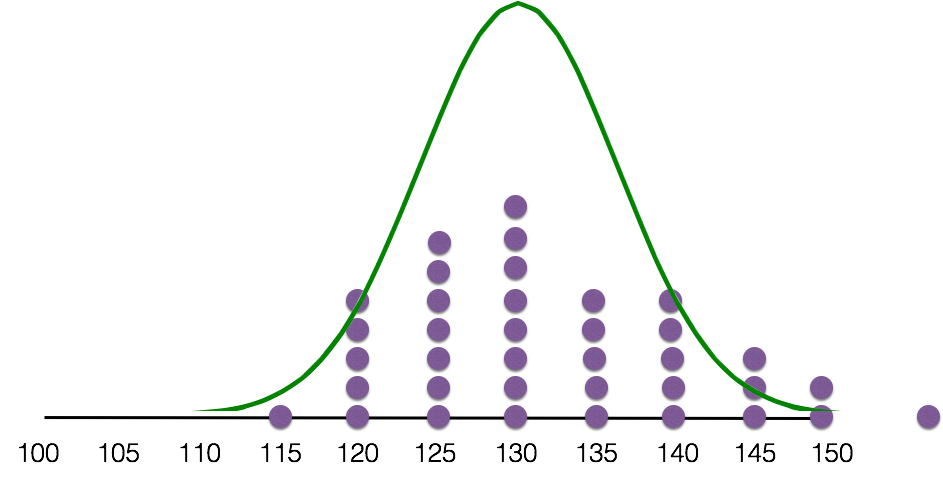
The normal distribution is a special one in that we can say things like 90% or 95% of all the values in the distribution will be between two specific values. In fact, 95% of all values are within 2 standard deviations of the mean. The lower and upper bounds provide the confidence interval. All that is necessary is to compute the standard deviation of the sample. This standard deviation is called the standard error. Thus, the more scattered the sample means, the larger the standard error.
Luckily, it is not necessary to collect dozensof samples. There is a formula:
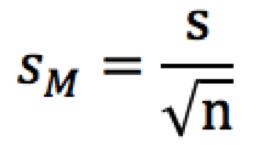
The standard deviation of the sample is expressed as a proportion of the sample size. What this formula tells you is that the smaller the sample size, the larger the standard error, and the larger the standard error, the wider the confidence interval. Smaller sample sizes are thus associated with less precise estimates.
The correct interpretation of a 95% confidence interval is that if 100 samples were run, 95% of the sample means would be within the lower and upper bounds of the interval. The narrower the confidence interval, the more precise the estimate.
